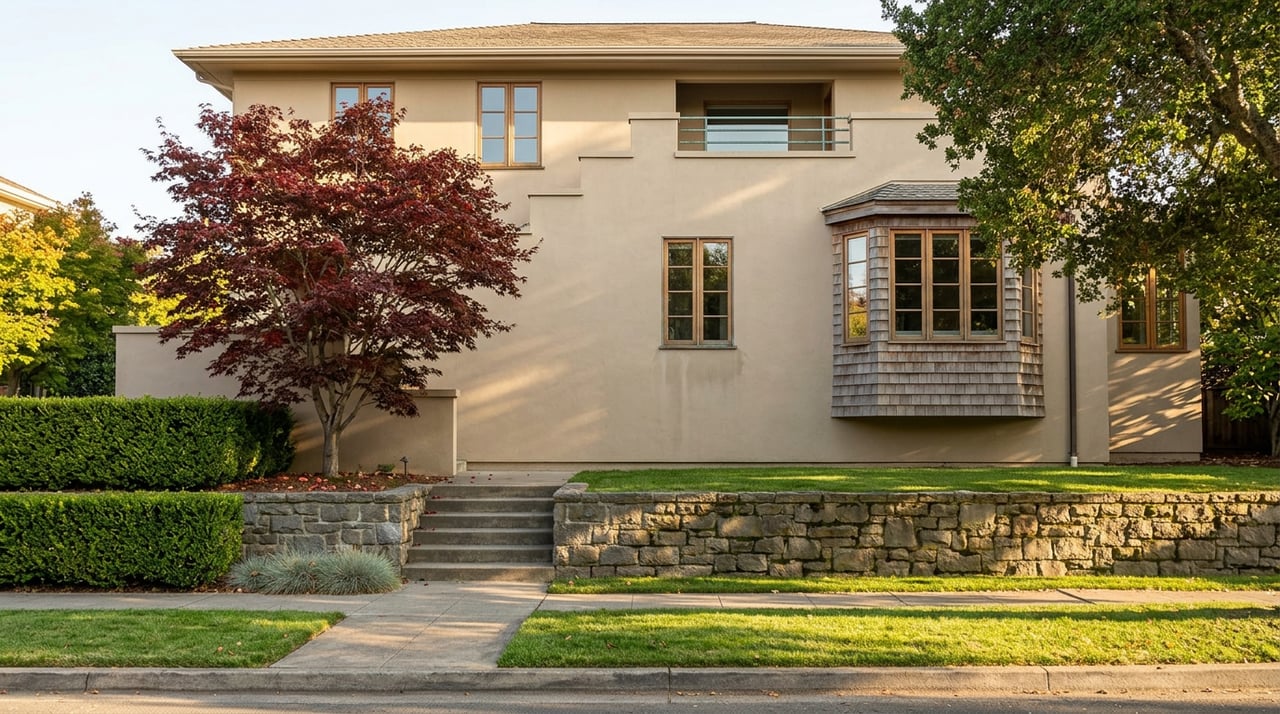
In the fall of 2017, a house at 1800 Sonoma Avenue in Berkeley went on the market at $1,095,000. A month later it closed at $1,640,000, according to the multiple listing service, a full $545,000 above what the seller had asked. Berkeleyside covered the sale as an example of a practice East Bay agents had a name for: egregious underpricing. The house wasn't underpriced by accident. It was priced low on purpose, to pull in enough buyers to start a bidding war that would land well above what a fair asking price would have produced.
That was nine years ago. The tactic never went away. In North Berkeley today, homes are selling over asking price at a rate of 88 percent, with the average sale coming in about 40 percent above list, according to recent brokerage data. A house listed at $1.2 million in that market is realistically a $1.7 million house. The number on the sign was never meant to be the number you pay.
If you're reading Berkeley listings against a citywide median you saw on a portal, you're comparing yourself to a number that was built to be broken.
The Median You're Reading Depends On Who's Counting
Ask three sources what Berkeley homes are worth right now and you'll get three different answers, and the disagreement itself tells you something. As of late June 2026, one major home-value index put Berkeley's typical home value at $1,395,342, down 8.9 percent from a year earlier. Over the same window, closed-sale data for the three months ending June 2026 showed a median of $1.5 million, up 2.6 percent year over year. At the county level, the California Association of Realtors reported Alameda County's July 2026 median at $1,275,000, up 2.0 percent from a year earlier, with homes selling in a median of 15 days on just 2.0 months of supply.
These aren't typos or bad data. They're measuring different things. A value index reflects the full stock of homes in the city, occupied and unlisted included, so it moves slowly and lags behind what's actually trading. Closed-sale data only counts what sold, and what sold in a given month skews toward homes that were well prepared and competitively priced. When homes are underpriced on purpose to draw bidding wars, the closed-sale number captures the aftermath of that strategy while the broader value index doesn't.
That's the first reason a single Berkeley median is close to useless for planning a purchase or a sale. The second reason is geography.
What Berkeley Actually Costs, Neighborhood by Neighborhood
Berkeley is not one market wearing one price tag. Recent listing data broken out by neighborhood shows just how wide the spread runs even before the underpricing effect gets added on top:
| Area | Typical Listed Price (2026) |
|---|---|
| West Berkeley | around $996,000 |
| South Berkeley | around $995,000 |
| North Berkeley | around $995,000 |
| Southampton | around $1,450,000 |
| Berkeley Hills | around $1,495,000 |
| Cragmont | around $1,720,000 |
ZIP code data shows the same split from another angle: homes in 94702 list around $973,000 while homes in 94705 list around $1.795 million. Those are both Berkeley addresses.
The neighborhoods with the lowest list prices, North Berkeley among them, are also the ones where the gap between list and close runs widest. So the number you see attached to a North Berkeley listing tells you less about what you'll actually pay than the number attached to a Cragmont or Berkeley Hills listing, where inventory is thinner and the underpricing tactic tends to lose its pull. As one longtime East Bay broker put it in the Berkeleyside reporting, once a home gets expensive enough, buyers stop showing up just because the price looks soft.
The Other Reason Your Address Doesn't Buy What You Think It Does
There's a second mechanism at work in Berkeley that has nothing to do with pricing strategy and everything to do with how the city assigns elementary school seats, and it changes what a specific block is actually worth.
Berkeley Unified splits the city into three zones for elementary assignment, Northwest, Central, and Southeast, a system the school board adopted in 1994 and still runs today. Each zone contains four or five elementary schools, and placement inside a zone happens through a lottery, not a neighborhood boundary. A family can live four houses from an elementary school and still be assigned somewhere else in the same zone. Only the zone is fixed to your address. The specific school isn't.
That's a meaningfully different setup from how school assignment works in most nearby cities, where a specific address maps to a specific school. In Berkeley, you can't buy the outcome by buying the block. Two nearly identical houses across the street from each other can send their kids to different elementary schools depending on how the lottery lands in a given year.
Practically, that means one lever that drives address-level price premiums in a lot of Bay Area suburbs doesn't operate the same way inside Berkeley. The premiums that do show up here, and they clearly do, at Cragmont and Berkeley Hills prices well north of a million and a half, attach to view, lot size, walkability to Shattuck or Fourth Street, and condition rather than a guaranteed school outcome. If you're comparing Berkeley to a neighboring city and wondering why the price map doesn't line up the way the school map might suggest, this is a real part of the answer.
Why the Market Feels Hotter Than the Number Suggests
There's a timing element on top of all this. A quarterly report on North Berkeley and the Berkeley Hills covering the second quarter of 2026 described a market that felt noticeably more competitive than the recent past, even with the number of active listings essentially flat, 43 in North Berkeley versus 43 a year earlier. The report tied part of that renewed intensity to anticipation around possible IPOs later in the year from major AI companies, with buyers reportedly trying to close before any new wave of tech wealth reaches the Bay Area. Thirty-six homes sold in North Berkeley that quarter, and the sharp move in the median was attributed in part to larger homes closing that spring.
Whether or not those IPOs land on the timeline the market is pricing in, the behavior is already showing up in bidding activity. That's a fourth layer sitting on top of underpricing, neighborhood spread, and the school lottery, and it's the one most likely to shift again before the end of the year.
Reading a Berkeley Listing the Right Way
None of this means Berkeley is unaffordable or unpredictable. It means the list price is doing a job other than telling you what a home is worth, and the citywide median is doing a job other than telling you what your specific street costs. A useful approach starts with the neighborhood, not the city: pull recent closed sales for the specific pocket you're looking at, not just the address range, and treat the list price as a starting bid rather than a target.
If you're weighing a purchase against a Berkeley listing that looks softly priced, that softness is often the point, not a discount. If you're preparing to sell, the same logic works in reverse: a strategically low list price paired with the right prep and timing can produce a stronger outcome than a number that looks more honest on day one.
This is exactly the kind of situation where pairing a clear read on the data with someone who negotiates these bidding wars for a living matters. At BloomHomes Team, Robin Donovan works through the comps and the zone-level pricing patterns before a number ever gets set, and Stephen Bloom handles the negotiation once the offers start coming in. If you're trying to figure out what a specific Berkeley block is really worth before you write an offer or set a list price, start with our Berkeley neighborhood guide or get a free home valuation to see where your address actually sits inside the spread.
Frequently Asked Questions
Does the underpricing strategy apply to condos the same way it applies to single-family homes? Not as reliably. Condo pricing in the East Bay tends to track closer to list price than detached single-family homes, partly because HOA dues and building condition give buyers a harder ceiling on what they're willing to bid regardless of how a listing is priced.
Can I improve my odds of a specific elementary school by choosing a specific street in Berkeley? No. Assignment happens by zone lottery, not by address-to-school boundary, so a specific block only guarantees you a zone, not a school. Families can request their top choices within their zone, but the district makes the final placement.
Why did the same house data show a falling median from one source and a rising median from another? Because they're measuring different populations. A broad home-value index tracks the entire housing stock, including homes that haven't sold recently, while closed-sale data only reflects homes that actually changed hands in that window. Both can be accurate at the same time.